Data flows can be super powerful and a great way to integrate data sources at scale. But sometimes things just go wrong. Here is one of the errors that I received when working with a client:
Mashup Exception Error
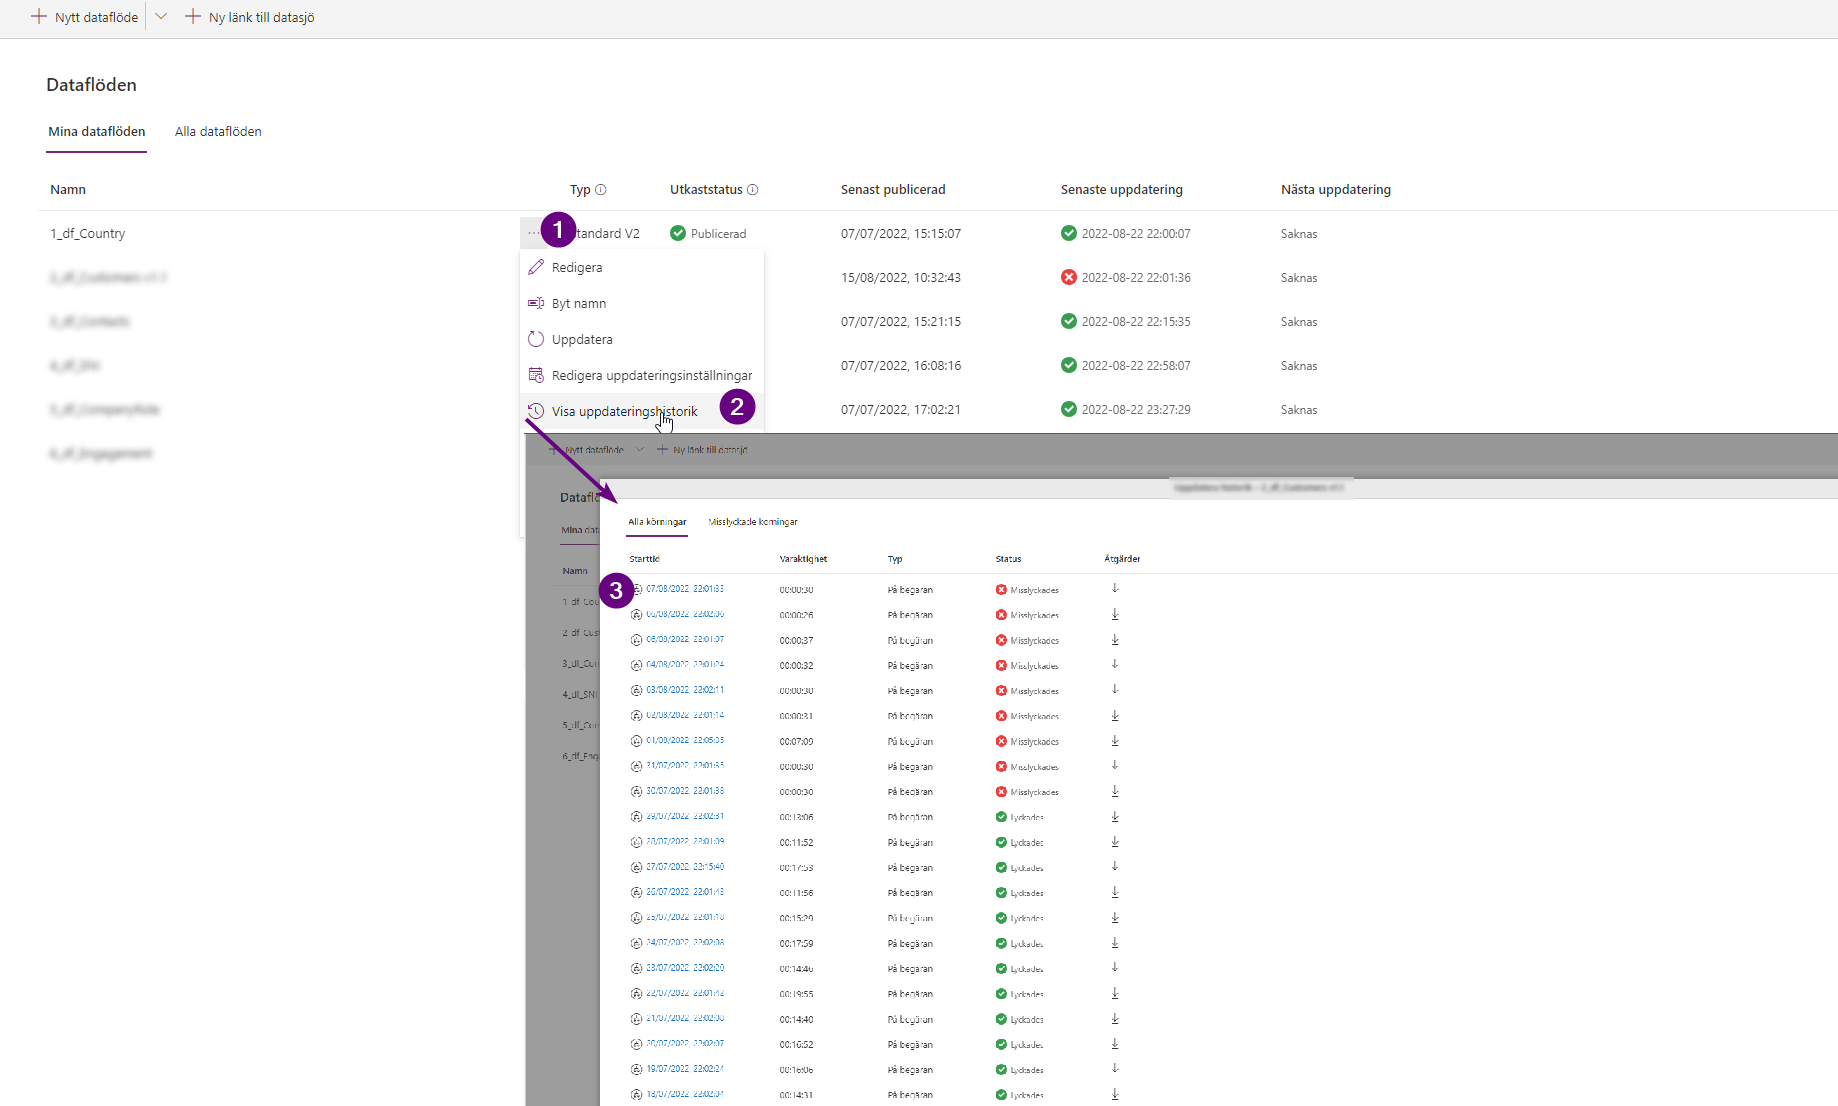
What dose that even mean? All I knew was that nothing was working with this dataflow when it received this error. So where can we find the logs for a dataflow?

- Click the tree ellipses for more options
- Select Update history
- Than select the relevant row to view
So in this case I had done all that and just saw that useless error message. So next thing, why did it start failing all of a sudden? Well there are a few this to consider:
- Microsoft has made an update or patch
Check the solution history and try to make correlations there. - The data has changed somehow and the ETL (Export, Transform and Load) dose not handle this change.
Spoiler, in may case it was option 1 and 2 🤨. When checking the solution history of the environment we found that a patch aligned perfectly with the errors occurred the first time. But how to fix that? Well not all Patches of Microsoft are created equal, some just means that tighter error thresholds has been implemented. That was probably the case here. When checking the data I found “string” values where “whole number” was expected, and I had not implemented any error handling there.
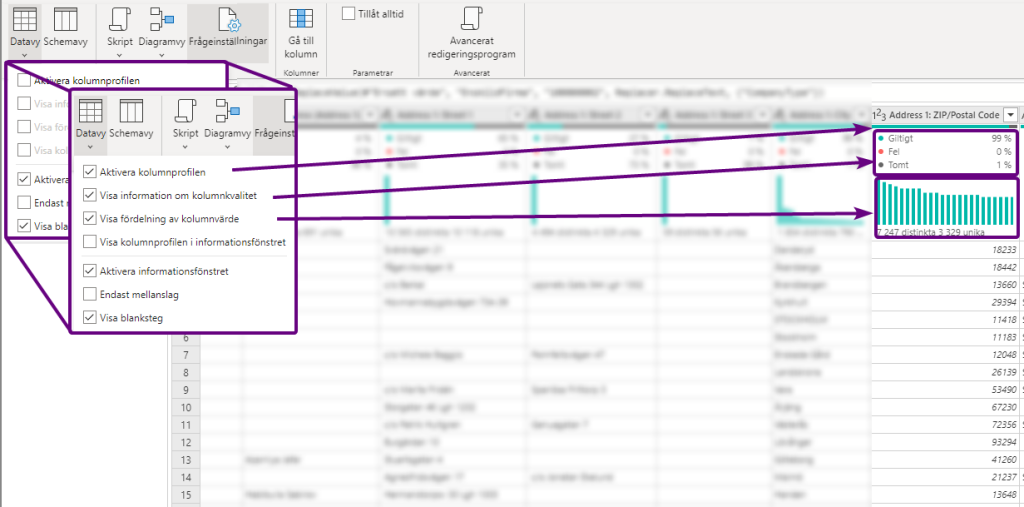
How to find errors in thousands of rows of data? Well we have one trick that saves us:

Column diagnostics come to the rescue! When this is enabled you can quickly see if the data in your dataset has any issues. In my example we have a standard column in dataverse that accepts text, however the column should only contain numbers and that was also autodetected when the dataflow was first created. Now same time later this had changed and text started to appear in that column. When I then corrected this by informing my client of the issue and replacing all the errors with “null” that the issue was resolved.
Unfortunately this is turned off by default in many cases and it can be hard to spot errors without that diagnostic feature turned on. Only by enabling this little thing we can solve many of our otherwise unknow errors.
Hope this helps anyone else with the same issue.

